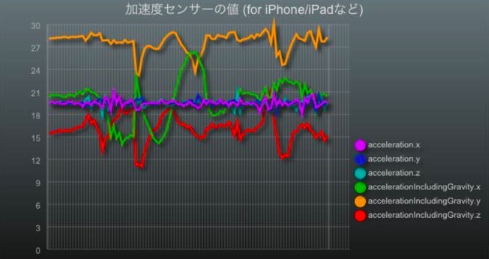
「加速度センターを見える化」
加速度センサーをグラフ化
グラフは3回分の平均なので、もっとシャープに使えます。
どのセンサーがどういうものなのかの実験に使ってみてください。
仕様はこちら「DeviceOrientation Event Specification」
グラフは「canvasChart」を使っています。
Visualize Accelerometer
Show the number from 3 times sensed on the graph.
Play with sensors to test.
Reference: "DeviceOrientation Event Specification"
Graph: "canvasChart"


