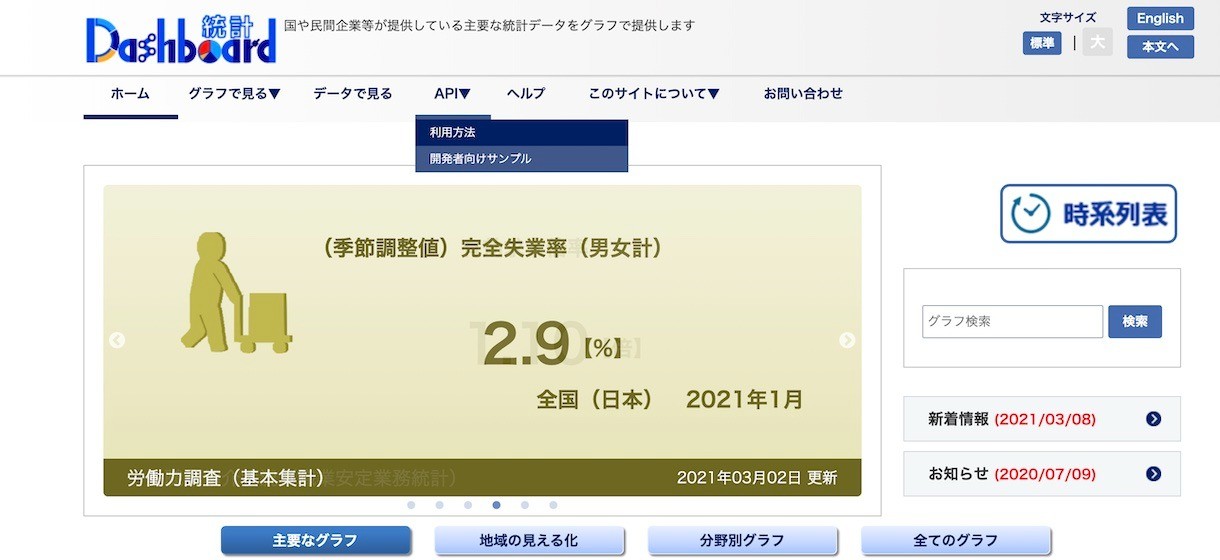
「統計ダッシュボード」のメニュー、API、開発者向けサンプルをみてみましょう。
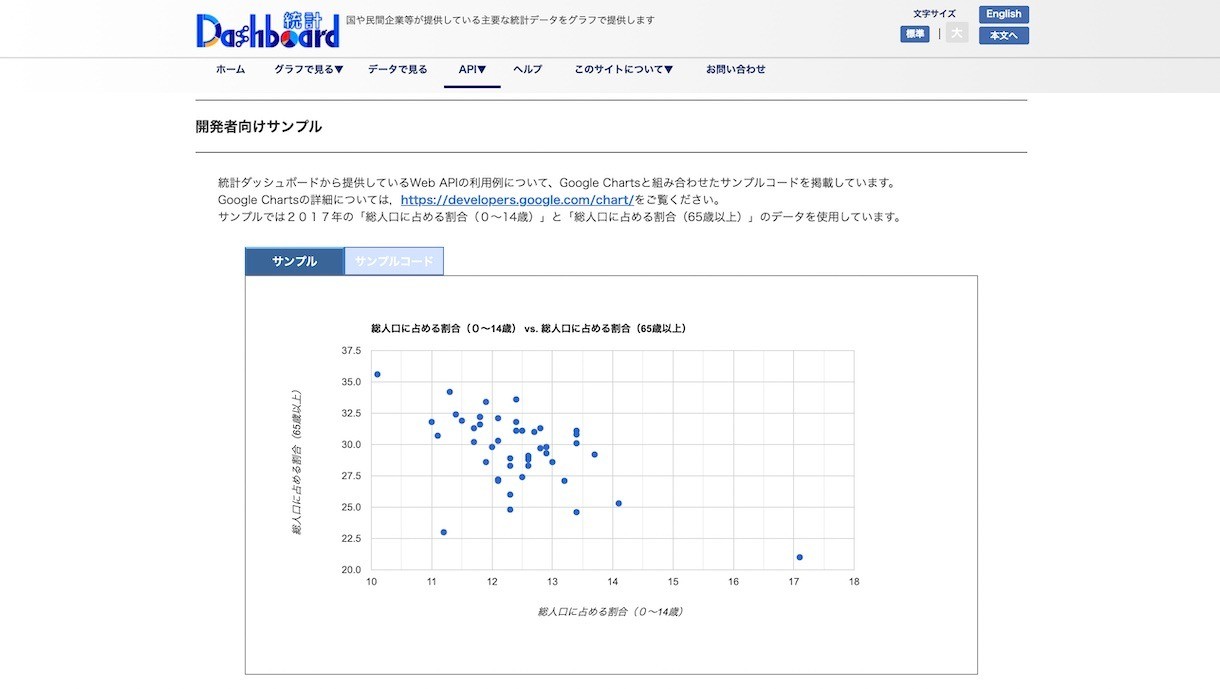
「統計ダッシュボード - 開発者向けサンプル」
オープンソースでの活用ナンバーワン言語、JavaScriptで作られたサーバーレスで動くwebアプリのサンプルがあっていい感じです!
CORS対応しているAPIがうれしいですね!高校の情報教材としても良さそうです。
ただ、おしいところが3つ。
- 古いJavaScript(jQuery、変数宣言不要、var)
- 非オープンソースに依存している
- 表記が冗長
共に改善しましょう!
まずは、JavaScriptを type=module のscriptタグにして、変数宣言を必須にしてより安全に、varをletかconstに変更。
グラフ表示モジュールをオープンソースのChart.jsをモジュール化した、Chart.mjsに変更して、import。
filter、findを使って表記をシンプルに。
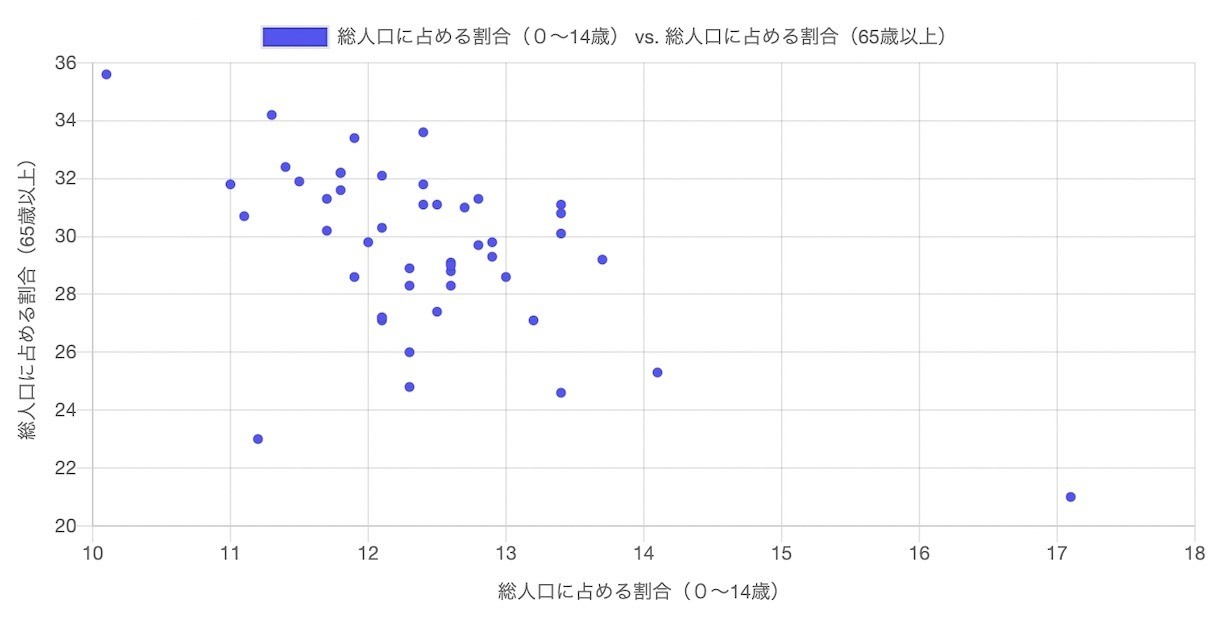
「https://code4sabae.github.io/statapi-sample/」(src on GitHub)
import Chart from "https://js.sabae.cc/Chart.mjs"; window.onload = async () => { // APIでデータ取得 const indicatorCodeX = "0201010010000020010"; const indicatorCodeY = "0201010010000020030"; const apiurl = `https://dashboard.e-stat.go.jp/api/1.0/Json/getData?Lang=JP&IndicatorCode=${indicatorCodeX},${indicatorCodeY}&Time=2017CY00&RegionalRank=3&Cycle=3&IsSeasonalAdjustment=1&MetaGetFlg=Y&SectionHeaderFlg=2`; const jsonData = await (await fetch(apiurl)).json(); console.log(jsonData); // データ準備 const dataX = jsonData.GET_STATS.STATISTICAL_DATA.DATA_INF.DATA_OBJ.filter(item => item.VALUE["@indicator"] === indicatorCodeX); const dataY = jsonData.GET_STATS.STATISTICAL_DATA.DATA_INF.DATA_OBJ.filter(item => item.VALUE["@indicator"] === indicatorCodeY); const indicatorNameX = jsonData.GET_STATS.STATISTICAL_DATA.CLASS_INF.CLASS_OBJ[0].CLASS[0]["@name"]; const indicatorNameY = jsonData.GET_STATS.STATISTICAL_DATA.CLASS_INF.CLASS_OBJ[0].CLASS[1]["@name"]; const data = []; dataX.forEach(x => { const dataValue = dataY.find(item => item.VALUE["@regionCode"] === x.VALUE["@regionCode"]).VALUE["$"]; const regionName = jsonData.GET_STATS.STATISTICAL_DATA.CLASS_INF.CLASS_OBJ[2].CLASS.find(item => item["@code"] === x.VALUE["@regionCode"])["@name"]; data.push({ x: parseFloat(x.VALUE["$"]), y: parseFloat(dataValue), label: regionName }); }); console.log(data); // グラフ表示 new Chart(chart, { type: 'scatter', data: { datasets: [{ backgroundColor: "#55E", label: indicatorNameX + " vs. " + indicatorNameY, data }] }, options: { scales: { xAxes: [{ scaleLabel: { display: true, labelString: indicatorNameX }, type: 'linear', position: 'bottom' }], yAxes: [{ scaleLabel: { display: true, labelString: indicatorNameY }, type: 'linear', position: 'bottom' }], }, tooltips: { callbacks: { label: (item, _data) => { return `${data[item.index].label} ${item.yLabel}%, ${item.xLabel}%`; }, } } } }); }
楽しい統計プログラミングを!


